

The best Amazon product research tools can give sellers remarkably precise-looking numbers: monthly sales, revenue, search volume, opportunity scores, launch budgets and competition ratings.
For this hands-on 2026 test, we used Helium 10, Jungle Scout, SellerSprite, AMZScout, SmartScout, ZonGuru and SellerApp on Amazon US. We also used Amazon Product Opportunity Explorer (POE) as a first-party niche benchmark and Amazon Seller Central as ground truth for a live product we own.
Our two common market tests were “kids toothbrush holder” and “stainless steel toothbrush holder.” We then used seller-owned ASIN B0DZCG62HD, a KIKMIK stainless steel lemon squeezer, to compare several third-party estimates with actual Seller Central performance where the reporting windows were comparable.
Quick Verdict : best Amazon product research tools compared
| Tool | Most useful in our test | Main limitation observed |
|---|---|---|
| Helium 10 | Xray market analysis, product/keyword workflow, historical ASIN estimate | Current estimate window was not explicitly date-bounded for a formal recent-period error calculation |
| Jungle Scout | Fast marketplace summaries and product-level screening | We did not capture a clean Article 03 same-period own-ASIN calibration |
| SellerSprite | Month-by-month ASIN history and seller-sales calibration | August evidence in the current pack is screenshot-based rather than raw export |
| AMZScout | Niche Score breakdown, 2-year history, product-level PL scoring | Full history export was plan-gated in our test; UI/export aggregation differed on one stainless metric |
| SmartScout | Search-term structure and product-level estimate | Monthly product estimate did not expose a clear start/end window |
| ZonGuru | Niche Finder plus Sales Spy historical export | Summary row briefly showed zeroes while historical data was available |
| SellerApp | Keyword research, Product Intelligence, listing-quality diagnostics | Extension unavailable in our test environment; some exports were plan-gated; Product Intelligence tracking was limited to 2 products on the account used for testing |
How we tested Amazon product research software
The research was conducted on Amazon US in September 2026. We kept the same two core product concepts wherever each platform supported them, then separated first-party Amazon data from third-party estimates so readers can see which numbers are actual, modeled or simply not comparable.
This distinction is the methodology rule for the entire article. A Seller Central order is an actual recorded transaction for our product; competitor-sales figures from research platforms are estimates. Search-demand figures can also use different definitions and time windows – such as a 360-day niche total, a 30-day exact-term estimate or a broader related-keyword average – so we do not read them as equivalent search-volume measurements. Formal error percentages are used only for calendar-aligned comparisons; everything else is directional context.
Reality check: estimates vs actual Seller Central sales
Full-month calibration: August 2026
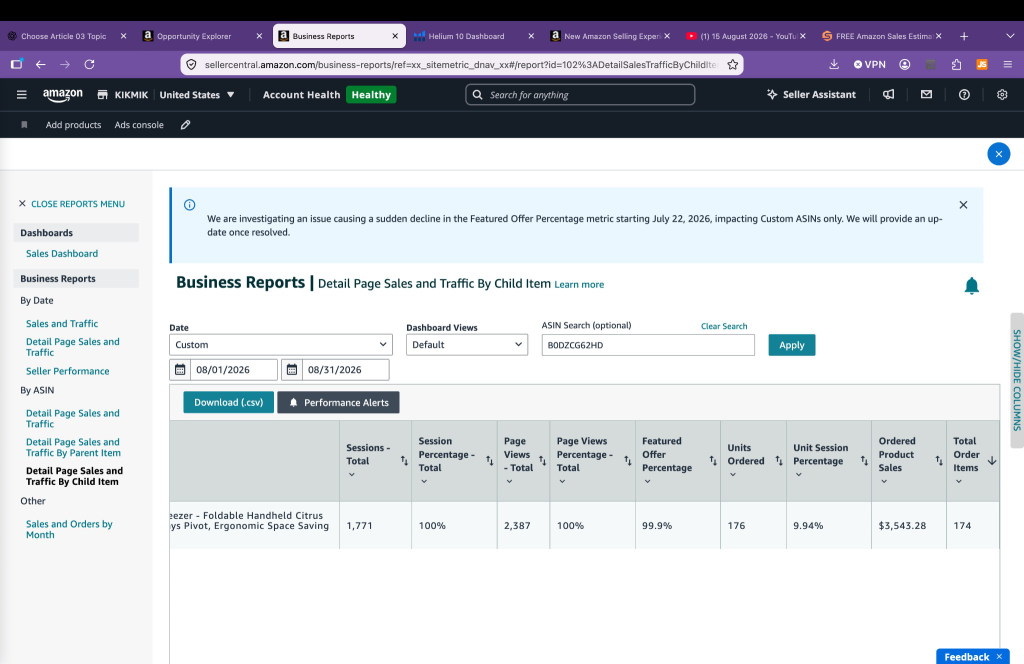
Seller Central recorded 176 units ordered and $3,543.28 in ordered product sales for B0DZCG62HD during August 1-31, 2026.
| Source | Period | Units | Revenue | Variance vs actual | Use |
|---|---|---|---|---|---|
| Seller Central | Aug 1-31, 2026 | 176 | $3,543.28 | Ground truth | Actual |
| SellerSprite | Aug 2026 | 180 | $3,651.00 | +2.27% units; +3.04% revenue | Calendar-aligned |
| ZonGuru Sales Spy | Aug 1-31, 2026 | 171.49 | $3,472.80 | -2.56% units; -1.99% revenue | Calendar-aligned |
| Helium 10 history | Aug 1-31, 2026 | 165.91 | Not captured as aligned revenue | -5.73% units | Calendar-aligned units only |
Recent 30-day directional check
- AMZScout showed a current parent-ASIN estimate of 200 units and $4,129.57 revenue, but its period was not aligned to either Seller Central window.
- SellerApp exposed a 0-2 orders/day range and less than $38 estimated revenue/day rather than a comparable monthly point estimate.
We therefore did not force either result into an artificial accuracy score.
Test market 1: Kids Toothbrush Holder
Amazon POE reported 486,873 searches over the past 360 days, +1.49% search-volume growth over 180 days, an average price of $13.04, 83 top-clicked products and a 1.62% return rate for the niche.
| Tool | Measurement frame | Demand / search signal (different frames) |
Sales / revenue signal | Price | Context |
|---|---|---|---|---|---|
| Amazon POE | First-party niche | 486,873 / 360d | – | $13.04 | 83 top clicked; +1.49% 180d growth; 1.62% returns |
| Helium 10 | Keyword + Xray | 7,582 | Avg revenue $46,397 | ~$14 | Avg reviews 2,616; avg BSR 96,431 |
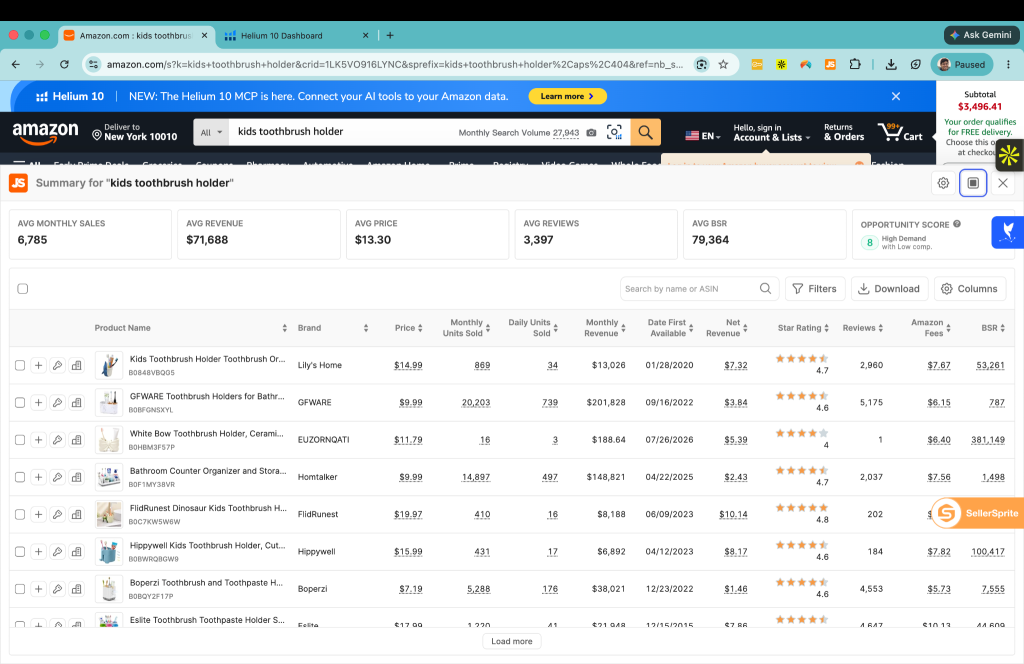
| Jungle Scout | Extension product set | – | Avg sales 6,785; avg revenue $71,688.25 | $13.30 | Avg reviews 3,397; avg BSR 79,364; UI score 8 |
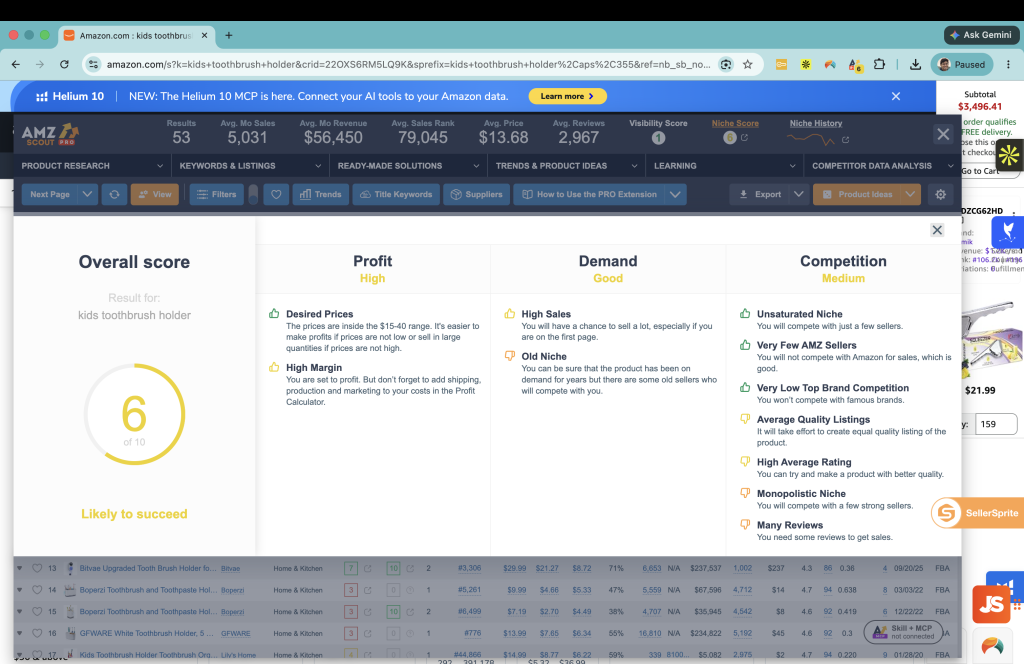
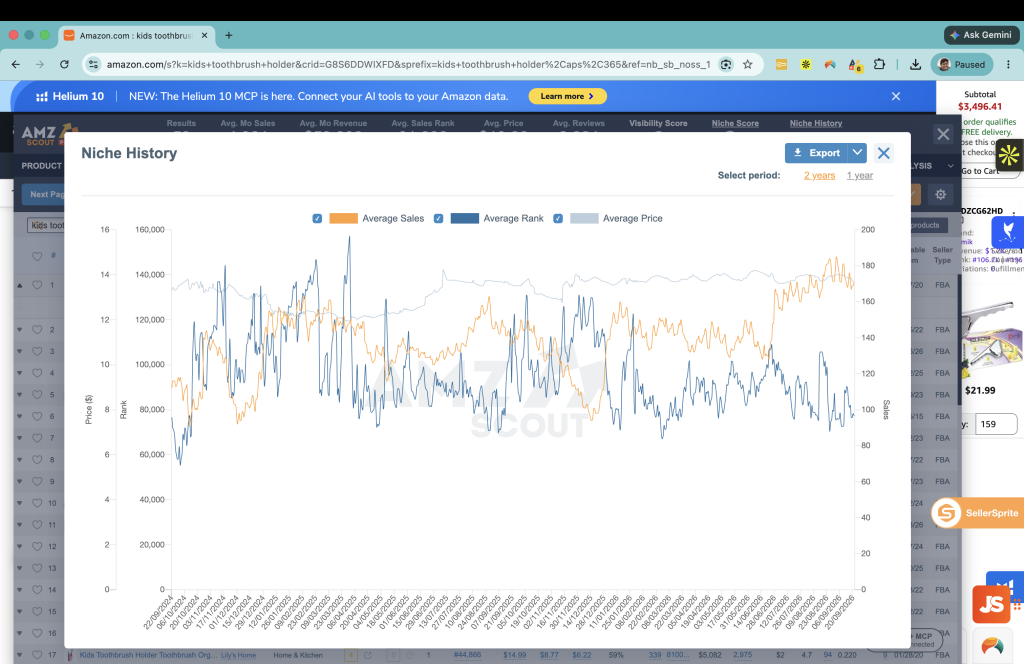
| AMZScout | PRO Extension set | – | Avg sales 5,031; UI avg revenue $56,450; export mean $56,449.57 | $13.68 | 53 rows; median sales 1,613; Niche Score 6/10 |
| SmartScout | Exact search term | 15,634 / 30d | 1,398 keyword sales | – | -18.48% monthly; 2,000 competing; title density 20%; CPC $0.68 |
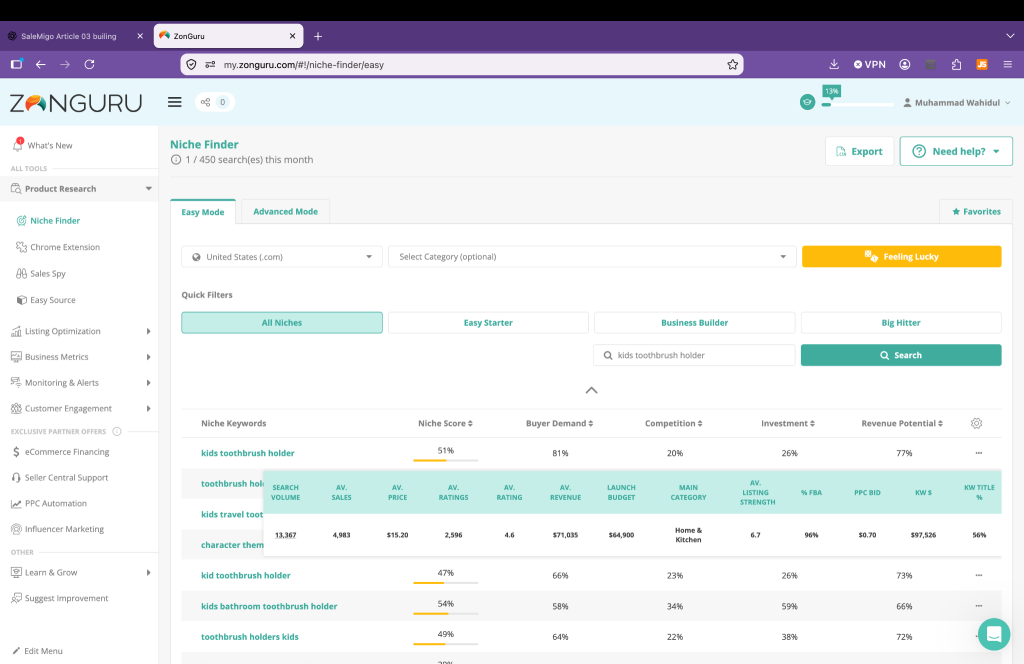
| ZonGuru | Niche Finder | 13,367 | Avg sales 4,983; avg revenue $71,035 | $15.20 | Niche 51%; demand 81%; competition 20% |
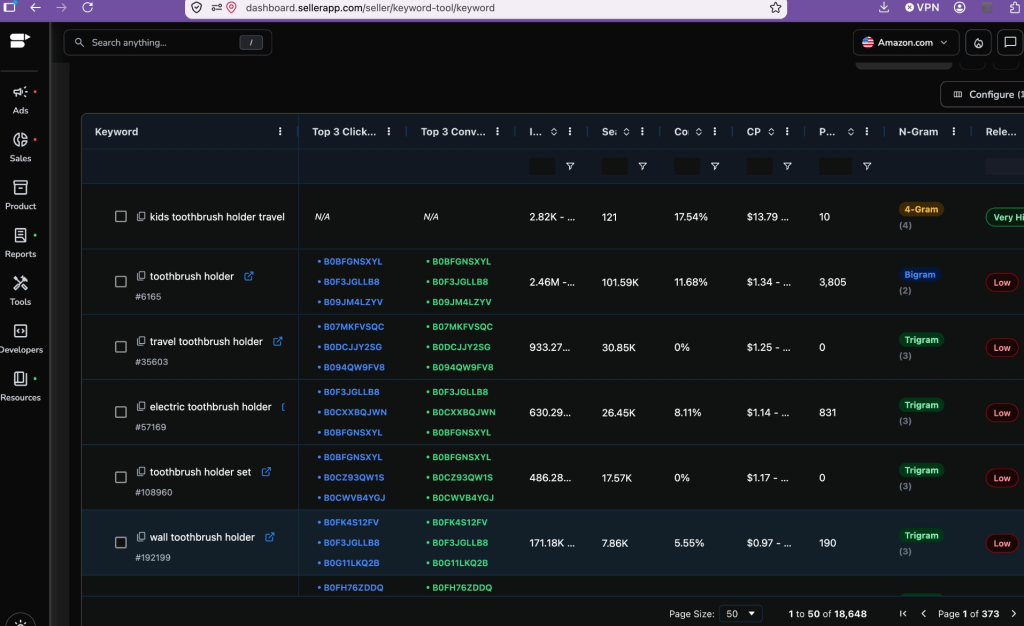
| SellerApp | Query-level universe | Avg 4,029 across 18,648 related keywords | – | – | Avg CPC $3.99; avg conversion 7.09%; exact target row not surfaced |
The price signals were relatively close across Amazon POE, Jungle Scout, AMZScout, Helium 10 and ZonGuru. Sales and revenue estimates varied more, which is not surprising because price is directly observable while competitor unit sales are modeled.
Jungle Scout and ZonGuru produced almost identical average-revenue figures for this market ($71,688.25 and $71,035 respectively), but that agreement should be treated as convergence between estimates – not proof of accuracy.
SellerApp behaved differently here: the query returned 18,648 related keywords, but the exact “kids toothbrush holder” row did not surface during our manual review of roughly 23 result pages. We therefore use SellerApp only as query-level related-keyword evidence for this case and do not invent an exact-term metric.
Test market 2: Stainless Steel Toothbrush Holder
Amazon POE reported 149,895 searches over the past 360 days, +16.13% 180-day growth, an average price of $12.32, 48 top-clicked products and a 1.88% return rate.
| Tool | Measurement frame | Demand / search signal (different frames) |
Sales / revenue signal | Price | Context |
|---|---|---|---|---|---|
| Amazon POE | First-party niche | 149,895 / 360d | – | $12.32 | 48 top clicked; +16.13% 180d growth; 1.88% returns |
| Helium 10 | Keyword + Xray | 2,104 | Avg revenue $21,770 | ~$13 | Avg reviews 3,157; avg BSR 177,828 |
| Jungle Scout | Extension product set | – | Avg sales 2,039; avg revenue $21,363.65 | $13.53 | Avg reviews 3,585; avg BSR 190,107; UI score 7 |
| AMZScout | PRO Extension set | – | UI avg sales 1,938; raw mean 1,857.02; avg revenue $17,271.28 | $12.74 | 48 rows; raw median sales 409; Niche Score 6/10 |
| SmartScout | Exact search term | 7,742 / 30d | 2,004 keyword sales | – | +5.48%; 1,000 competing; title density 2%; CPC $0.60 |
| ZonGuru | Niche Finder | 2,423 | Avg sales 1,910; avg revenue $22,387 | $13.22 | Niche 53%; investment 83%; revenue potential 50% |
| SellerApp | Exact keyword | ~2.14K | 106 estimated orders | – | 12.73% conversion; CPC ~$0.79; Relevance Very High |
The strongest cross-tool revenue convergence in our test appeared here: Helium 10 ($21,770), Jungle Scout ($21,363.65) and ZonGuru ($22,387) all clustered in roughly the $21K-$22K range. That is useful corroboration, but it still does not prove the true average revenue of the market.
AMZScout requires an explicit methodology note. Its UI headline showed 1,938 average monthly sales, while the exported Parent ASIN Est. Sales column averaged 1,857.02. We preserve both figures rather than silently choosing one, because they may reflect different aggregation logic.
Why averages can mislead product research
Headline averages can overstate what a typical listing looks like when a small number of dominant products pull the mean upward. In our AMZScout kids dataset, mean estimated sales were 5,030.58 while the median was 1,613. In the stainless dataset, the exported mean was 1,857.02 while the median was only 409.
Helium 10: what we learned
Helium 10 combined product-set analysis with keyword research more naturally than most tools in this test. More importantly, its historical sales data was one of the few datasets we could align to the full August Seller Central window.
For sellers who want to go deeper on keyword discovery and reverse-ASIN workflows, see our hands-on comparison of the best Amazon keyword research tools.
That August result was reasonably close in this single-product calibration. A separate current estimate was also directionally close to recent seller performance, although the tool did not expose an explicit date-bounded window for that current estimate.
Jungle Scout: what we learned
Jungle Scout was the fastest product-set summary to interpret at a glance. It made marketplace screening straightforward and readable, especially when comparing product-set sales, revenue, reviews and BSR without adding too much interface friction.
We treat its Opportunity Scores as screening signals, not launch recommendations. The underlying product set still needs to be checked for review concentration, brand dominance, listing age and whether a small number of products are pulling the averages upward.
SellerSprite: what we learned
SellerSprite stood out for month-by-month ASIN history and gave us one of the clearer historical views in this test. That made it especially useful for checking whether a current estimate made sense in the context of recent product performance.
The evidence strength is worth noting: the August SellerSprite figure in our pack was read from the captured interface rather than a raw export, so we treat that calibration as strong directional evidence rather than a perfect audit trail.
AMZScout: what we learned
AMZScout was useful because its headline Niche Score could be unpacked. The two test markets both scored 6/10, but the underlying demand, competition, history and product-set characteristics were not identical, so we treated the score as a screening summary rather than a standalone decision.
We also observed an interface-versus-export difference in the stainless dataset, while the full history export was plan-gated in our test. That makes AMZScout useful for visual niche screening and history context, but it also means the UI headline and raw export should not be treated as automatically interchangeable.
SmartScout: what we learned
SmartScout was most distinctive when we stopped treating it like another Xray-style product tool and used it for search-term structure, title density, competing-product context and keyword economics.
Its seller-owned product estimate was directionally close to recent seller performance, but because the monthly estimate did not expose a clear start/end window, we treat it as directional rather than calendar-aligned evidence.
SmartScout offer: Use code SALEMIGO25 for 25% off your first 3 months.
ZonGuru: what we learned
ZonGuru became especially useful once we moved beyond the summary row and used Sales Spy for historical product-sales monitoring. That gave us a more useful view of how individual products behaved over time than a single headline estimate could provide.
The same test exposed a useful reliability lesson: the Sales Spy summary row showed zero values while the historical series contained usable sales and revenue data. We therefore treated the history/CSV as the source of record rather than the summary row.
SellerApp: what we learned
SellerApp provided useful keyword research, Product Intelligence and listing diagnostics, but it also produced the most test-environment friction. The kids query did not surface the exact target phrase, keyword export was plan-gated, the Chrome extension was unavailable in our environment, and our account could track only two Product Intelligence products.
Even with those constraints, Product Intelligence still provided useful product-level context and listing-quality signals during the test.
Testing environment note: We treat the extension and plan limitations as observations from our test environment, not as universal platform limitations.
What we trust most in Amazon product research
| Data type | How we use it |
|---|---|
| Seller Central actual sales | Ground truth for products we own |
| Amazon POE first-party niche data | Strong Amazon-side market context |
| Observable marketplace price | Highly cross-checkable |
| BSR | Useful demand context, but not sales itself |
| Third-party monthly sales estimates | Directional unless the window can be validated |
| Estimated revenue | Directional |
| Search volume | Useful only after understanding the tool’s definition and time frame |
| Opportunity / niche scores | Screening shortcuts, not final decisions |
| Launch budgets | Planning estimates, not guaranteed capital requirements |
The workflow we would use for real product research
Start with first-party Amazon context where possible. Use Product Opportunity Explorer to understand niche-level demand, growth, click concentration, price and returns.
Use a marketplace research tool to size the competitive landscape. Helium 10, Jungle Scout, AMZScout or ZonGuru can establish plausible sales and revenue ranges.
Inspect individual products, not only averages. Review distribution, dominant sellers, listing age and outliers.
Cross-check important assumptions with another platform. Agreement increases confidence; disagreement tells you where to investigate.
Use historical data to look for seasonality, spikes and decline.
Analyze search behavior separately from product-market revenue. SmartScout and keyword-oriented tools can reveal how demand is distributed across search terms.
Run your own economics. Landed cost, Amazon fees, PPC, storage, returns and margin can invalidate an otherwise attractive market.
Which Amazon product research tool fits your workflow?
There is no single platform that was strongest at every task in this test. A better buying decision is to match the tool to the research problem you are trying to solve.
Frequently asked questions
How accurate are Amazon sales estimators?
Helium 10 vs Jungle Scout: which should you choose?
Is Helium 10 sales data accurate?
Is SellerSprite accurate?
Is SmartScout a product research tool?
Is ZonGuru useful for product research?
Is SellerApp useful for product research?
Why can average monthly sales be misleading?
Can you rely on one opportunity score?
Final verdict
The biggest lesson from testing seven Amazon product research platforms was not that one tool had the “correct” number. It was that good product research depends on understanding what each number represents.
Several third-party estimates came surprisingly close to actual Seller Central performance for our live ASIN when we could align the time window. Multiple tools also converged around a similar revenue band in the stainless-steel toothbrush-holder test. At the same time, we found large differences in search volume, market size, averages and proprietary scoring.
The safest approach is therefore to use Amazon first-party information where available, use third-party software to estimate and explore, inspect the underlying listings, cross-check important assumptions, validate unit economics separately and treat repeated agreement as increased confidence – not certainty.